Graphing IEP progress shouldn’t take hours. Teachers shouldn’t be wrestling with Excel, fixing broken formulas, or trying to make charts look decent. The truth is: you can graph progress instantly with a tool that builds the charts for you. No spreadsheets needed.
Below are simple ways to make graphing easier for your team, why visual data matters so much for compliance, and how schools can set up a system that saves hours.
Quick Answer
You can graph IEP progress instantly by using a tool that creates the chart for you in the background. No spreadsheets, no formulas, no formatting.
What This Actually Means
Teachers shouldn’t be spending planning time building charts from scratch. When every new score automatically updates the graph, the data becomes more meaningful.
Automatic graphs let teachers focus on instruction instead of formatting. And instead of looking at a list of numbers, everyone can see the student’s growth in seconds.
Why This Matters
Clear visual data helps everyone involved in special education:
- Administrators can quickly see progress without digging through notes.
- Parents understand graphs instantly, even if they aren’t familiar with the measurement tool.
- Teachers feel more confident explaining progress because the picture tells the story.
- Districts avoid misunderstandings, complaints, and due process issues because documentation is easy to read.
A good graph removes all guesswork. It shows what’s working, what’s not, and where a student might need support.
Real Classroom Example
Imagine a teacher tracking weekly reading fluency or work completion. Each time they enter a new score—42, 47, 51—the graph updates instantly and shows the pattern.
At the IEP meeting, the teacher isn’t flipping through notebooks or old spreadsheets. They simply show the graph. Everyone in the room can see the progress. No confusion, no arguments, no guessing.
Here is an example of what that looks like:
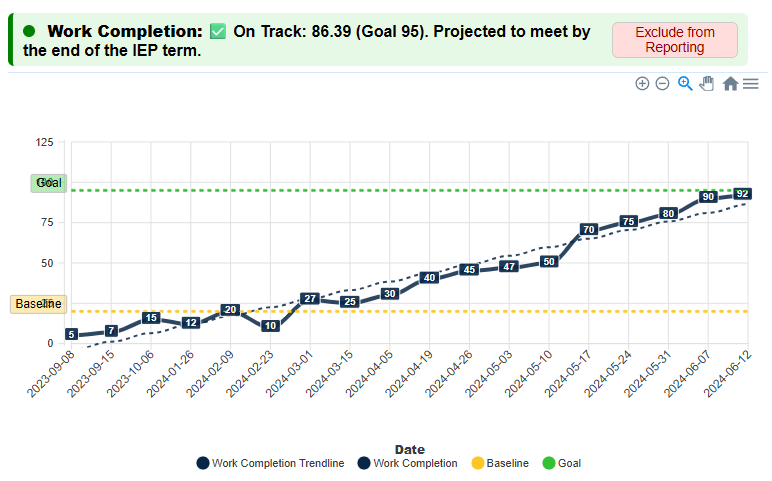
The trendline shows the overall direction. The baseline and goal lines give everyone context. And the student’s scores create a visual story that makes sense instantly.
Simple Checklist for Schools
To make graphing easy and consistent across classrooms, districts only need a few things:
- Pick one graphing tool for the whole school
- Make sure graphs are created automatically
- Keep graphs simple (clean line graphs work best)
- Add baseline and goal lines to make growth obvious
- Use the same format across all buildings so everyone speaks the same “data language”
These small steps alone fix most of the progress-monitoring confusion that districts deal with.
What Districts Usually Get Wrong
Most districts still rely on spreadsheets. And because of that:
- Every teacher builds graphs differently
- Files get lost or overwritten
- Formulas break
- Data ends up inconsistent
- Admins can’t compare progress between teachers
- Updates take too much time
This isn’t a teacher problem. The tools are the problem. Spreadsheets weren’t designed for IEP monitoring. They’re slow, fragile, and difficult to keep consistent.
How to Fix It (Without Adding Work)
The easiest way to fix this is simple:
Use one system that graphs everything automatically.
When all teachers use the same tool:
- Time is saved
- Visuals are consistent
- Parents understand progress
- Meetings go more smoothly
- District-level documentation improves
This is exactly what IEP Report does. Graphs update the moment a teacher enters a score. No formatting, no formulas, no wasted prep time.
What to Try Next
Choose one student and switch from a spreadsheet to an automatically generated graph. Then compare:
- Which one’s faster?
- Which one’s easier to read?
- Which one looks more meeting-ready?
Most teachers say the same thing:
Once they start using automatic graphs, they never go back.
2 thoughts on “Easy Ways to Graph IEP Progress Without a Spreadsheet”