When a student has a Specific Learning Disability and is more than two years behind in math, the goal cannot be small.
In fact, it cannot be comfortable.
If a student is performing at a 3rd-grade level in calculations and is now in 5th grade, the IEP team is not just aiming for improvement. The team is aiming for acceleration.
However, that raises a real question:
How do you track progress across multiple grade levels inside one IEP goal?
If you are unsure what strong monitoring should look like, What Does Good IEP Progress Monitoring Look Like? (With Examples) walks through practical models.
Because simply writing “increase from 60 to 80” is not enough if the student must move from 3rd-grade standards toward 5th-grade expectations.
In practical terms, schools need a clear system to track IEP goals when a student is two years behind in math.
Let’s walk through what that actually looks like in practice.
The Reality of a Two-Year Discrepancy
When a student shows a discrepancy of more than two years between ability and achievement, the growth requirement is different.
They are not just maintaining pace.
They are closing a gap.
For example:
- Baseline: 50 percent accuracy at a 3rd-grade calculation level
- Instructional baseline score: 60
- Goal: 80 percent accuracy
- Target: 5th-grade calculation standards
This means the student must show progress that moves through:
- 3rd-grade mastery
- 4th-grade calculation skills
- 5th-grade expectations
That is layered growth.
Therefore, the way we track data has to reflect that layered structure.
Why a Single Data Line Is Not Enough
Many progress monitoring systems track one dataset per goal.
That works when growth is linear.
However, in a situation like this, the student is not just increasing accuracy. They are increasing complexity.
For example:
- 3rd grade: single-digit multiplication, basic division
- 4th grade: multi-digit multiplication
- 5th grade: long division with remainders, two-digit by two-digit multiplication
If all of that is placed on one simple percentage line, the data can become misleading.
The graph might show “70 percent.”
But 70 percent of what?
3rd-grade problems?
4th-grade tasks?
Mixed assessments?
Without clarity, the progress becomes hard to defend.
Tracking Growth Across Multiple Grade Levels
Instead, progress can be tracked in structured layers:
- Dataset 1: 3rd-grade calculation mastery
- Dataset 2: 4th-grade calculation tasks
- Dataset 3: 5th-grade calculation tasks
Each dataset has its own accuracy trendline.
This allows the team to see:
- Is 3rd grade solid and stable?
- Is 4th grade improving?
- Is 5th grade beginning to emerge?
As a result, the IEP team can clearly demonstrate acceleration.
This is especially important when a student must make more than one year of growth within one IEP term.
If you have read our article on How to Write a Baseline That Actually Works, you already know that clarity at the beginning protects you later. The same principle applies here.
Why This Matters for Compliance and Instruction
This is not just about having a nice graph.
It is about answering hard questions:
- Are we truly closing the gap?
- Is instruction working?
- Is the student catching up fast enough?
When growth must exceed one year in a year, progress monitoring must show movement across grade-level expectations.
According to the U.S. Department of Education guidance on IEP implementation, schools must measure progress in a way that meaningfully reflects the student’s advancement toward annual goals. (Link to U.S. Department of Education IDEA guidance page)
Therefore, if the goal states movement toward 5th-grade standards, the data should clearly reflect performance at those standards.
Otherwise, the documentation becomes weak.
What a Multi-Layer Goal Looks Like in Practice
Consider this goal:
Given explicit instruction, guided practice, and grade-level math calculation tasks aligned to 5th-grade standards, the student will improve math calculation skills from a current 3rd-grade level to at least a 5th-grade instructional level by accurately solving multi-digit multiplication and division problems with 80 percent accuracy across three consecutive data collection points.
Baseline: 60
Goal: 80
However, the data collection does not rely on a single line.
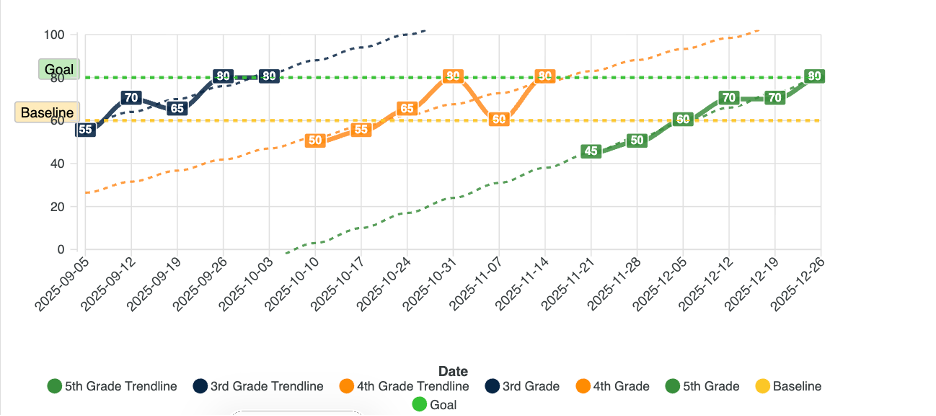
Instead, it tracks:
- 3rd-grade accuracy trend
- 4th-grade accuracy trend
- 5th-grade accuracy trend
Now the graph tells a story.
First, 3rd-grade accuracy stabilizes.
Next, 4th-grade performance rises.
Then, 5th-grade tasks begin moving toward 80 percent.
That is catch-up growth.
Why Flexibility in Data Collection Matters
Some systems limit the number of data categories you can track inside one goal.
However, when working with students who have significant gaps, flexibility becomes critical.
Sometimes you need:
- Separate datasets by grade level
- Separate datasets by skill type
- Separate datasets by setting
A rigid system forces teachers to compress complex growth into simple lines.
In contrast, a flexible system allows the data to match the instruction.
We explored a similar idea in The Silent Problem in Special Education: Data That Does Not Travel With the Student, where structure determines clarity.
The more transparent the data, the stronger the story.
The Bigger Picture: Acceleration Is Different From Growth
Finally, we need to say this clearly:
Acceleration is not the same as typical growth.
A student who is two years behind cannot close the gap with average yearly progress.
They must grow faster than average.
Therefore:
- Instruction must be intentional.
- Data must be layered.
- Monitoring must be frequent.
- Trends must be visible.
When the graph shows multiple grade-level lines rising over time, the team can confidently say the student is moving forward, not just maintaining.
That clarity protects teachers.
It protects schools.
Most importantly, it protects the student.
A Simple Reflection for Your Team
If you have a student who must move more than one grade level in a single IEP term, ask yourself:
Can your current progress monitoring system actually show that?
If not, it may be worth reviewing how your data is structured.
Strong documentation does not happen by accident.
It happens when the data matches the complexity of the goal.
And when that happens, progress becomes clear.