The problem no one notices at the IEP meeting
Most IEP data problems don’t show up during the meeting.
They show up months earlier.
- A data point here.
- A missing week there.
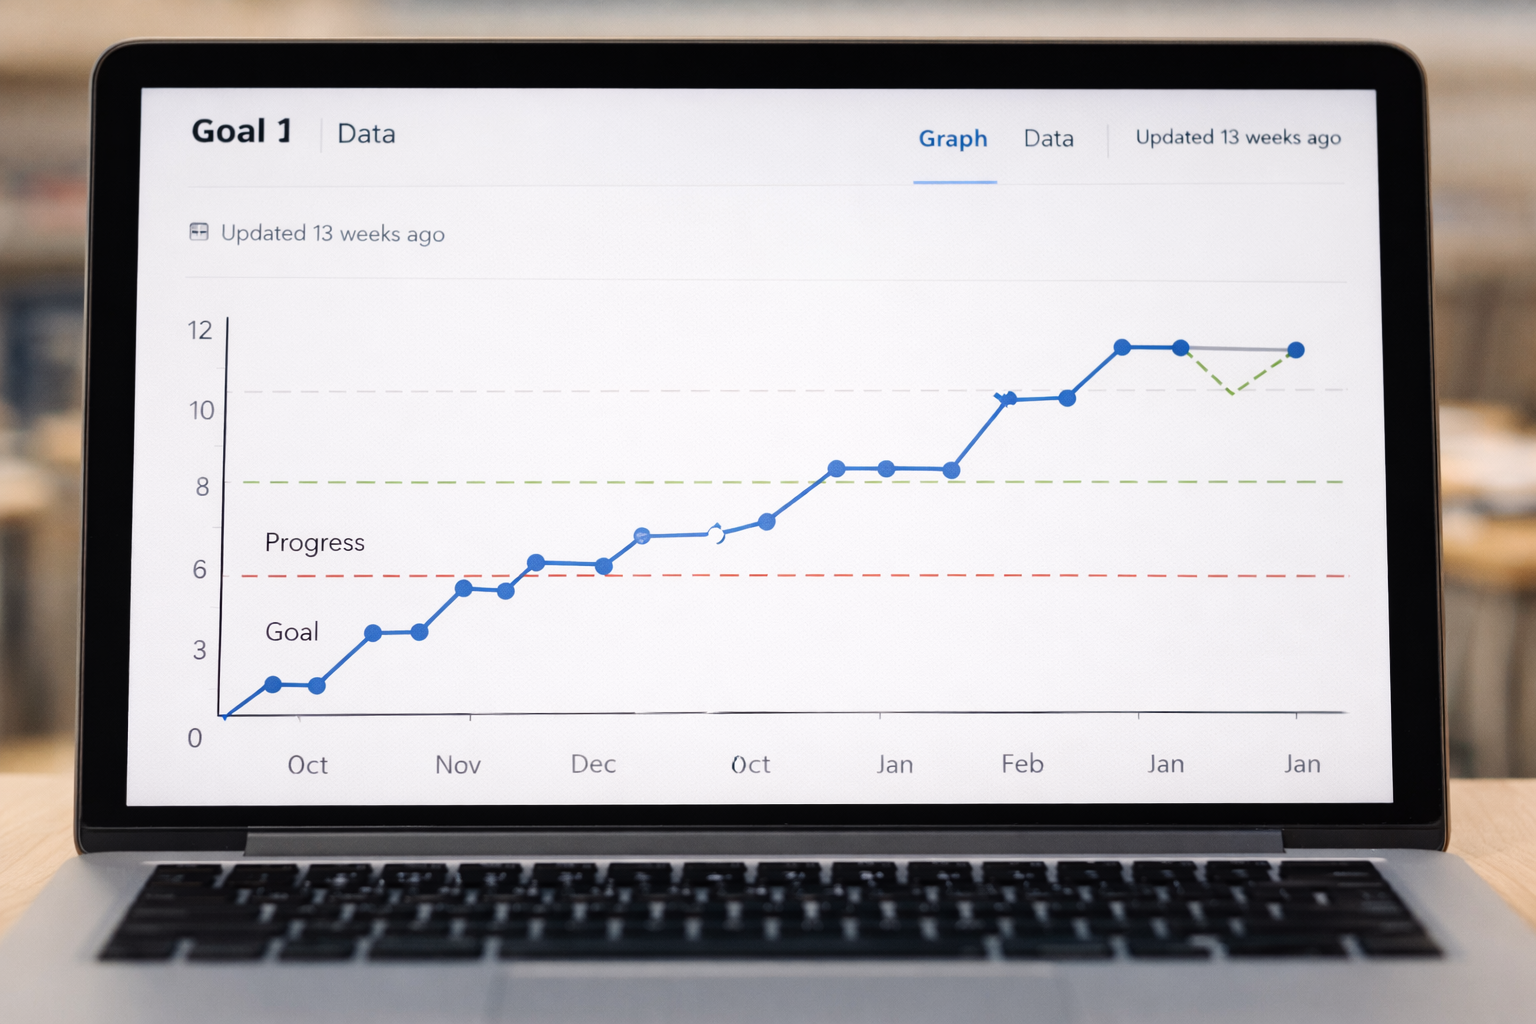
- A graph that looks fine but doesn’t actually tell a story.
By the time a team is sitting around the table, the data already exists. The only question left is whether it can be trusted.
That’s where “good enough” data becomes dangerous.
What “good enough” usually looks like
In most schools, progress monitoring happens like this:
- Data is collected inconsistently
- Measurement methods quietly change
- Baselines are retyped or approximated
- Graphs are recreated from memory or spreadsheets
- Teachers inherit data they didn’t collect
Nothing here feels wrong in the moment.
But taken together, it creates data that looks compliant while quietly losing meaning.
The real risk isn’t a bad graph
The real risk is false confidence.
A graph can look clean and still be misleading.
Teams may believe:
- A student is making progress when they are not
- An intervention is working when it hasn’t been implemented consistently
- Data is comparable across teachers or years when it isn’t
That’s how schools end up reacting instead of adjusting instruction early.
Good progress monitoring answers only three questions
- Is this student actually improving?
- Is the data collected the same way every time?
- Can the next teacher trust this without explanation?
If your system can’t answer all three, it’s not doing its job.
Why continuity matters more than volume
More data does not fix bad data.
Schools don’t struggle because they lack numbers. They struggle because the data changes hands, formats, and meaning over time.
When progress monitoring systems rely on individual teachers, spreadsheets, or personal workflows, continuity breaks the moment something changes.
- A student changes case managers
- A schedule changes mid-year
- A teacher leaves or switches roles
- A program restructures
- A new team inherits old data
At that point, teams aren’t evaluating progress. They’re reconstructing history.
What strong progress monitoring actually looks like
Strong progress monitoring doesn’t feel impressive. It feels boring in the best way.
The same measurement method. The same scale. The same baseline. The same goal. Month after month.
When systems are built correctly, teams stop arguing about the graph and start talking about instruction.
- Data follows the student
- Measurement methods stay locked
- Baselines and goals don’t get retyped
- Graphs update automatically
- Admins can see progress without chasing people
Why we built IEP Report this way
We built IEP Report because we were tired of rebuilding data every year.
As classroom teachers, we saw how often good work was undermined by systems that couldn’t preserve consistency.
Our focus wasn’t creating more reports. It was protecting the integrity of the data teachers already collect.
Compliance isn’t about having a graph.
It’s about having a graph you’d stand behind months later.